Friday, 15 March 2019

Sargasso sea an unique geography

Sargasso sea :--
--------------------
 Sargasso sea is located in the north Atlantic ocean north of Bermuda. It's is the only sea bounded not by land but by oceanic current . The North Atlantic gyre holds the water. It obtained the name from Portuguese word sagassum which means a seaweed. Sargassum is a brown algae which is free floating like a plankton River.
 It is confined between 20N -35N degree and 30W-70W degree. It is bounded by north equatorial current in the south, Antilles current in south west, gulf stream in west, north atlantic in the north, Canary current in the east direction. Sargasso sea is characterised by depth 1500m-7000m, still water, saline, evaporation rates >> precipitation rates, horse latitude belt, sargassum seaweed covers 2million square km area in the sea.
 Marine biologist declared sargossa sea as biological desert because of lack of nutrients, devoid of plankton in large part of it, absence of large fish. High salinity of Sargasso sea due to lack of oceanic water mixing, high temperature (26) and higher evaporation rates. But known for small marine lifeforms such as turtles,shrimp,crab, small size fishes, eels lay eggs,etc these animals has unique adaptation to high sea weed(Sargassum). Which is not available anywhere on earth.
It has great economic value as mention above. The resource is used by carribean nations such as Bermuda, Antilles islands. This region is highly vulnerable to pollution, oil spills, etc,.

Measures adopted to conserve and protect the Sargossa sea unique ecosystem. Since 2005, IUCN consider this region under loss of biodiversity because it falls away from the national jurisdiction boundary. Few agreement reached are :-
1) Hamilton declaration in 2014 signed by 5 nations.
2) Bermuda alliance for Sargasso sea.
3)  mission blue
4) Sargasso sea alliance.

Monday, 11 March 2019

Aral sea shrinking

Aral sea shrinking
---------------------------
Aral sea was the 4th largest lake(68000 sq km area) since 1960, more than 90% water is being lost. It shrink in size,  broken down into two parts. It arise due to :-
1) diversion of two Rivers that feed it such as syr-darya and amur-darya for irrigation purpose during the USSR times for cotton fields.
2) daming of Rivers by Kyrgistan, Tajikistan,
3) encroachment of lakes by Uzbekistan and Kazakhstan.
4) climate change and global warming leads to desertification,here due to dry climate water is lost more per year.
5) long period of continuous droght in the central Asia.
6) first time it's Eastern basin is completely dried in 600 years.
7) in 1960s, Soviet to make vast steppes bloom. They built an enormous irrigation network more than 20,000 miles of canals, 45 dams and more than 80 reservoirs , all to irrigate fields of cotton and wheat in Kazakhstan and Uzbekistan.

Impacts of Aral sea drying is :-
 1) waterbody become more saline, in saltier sea million of fishes died.
2)by 20009 lake is separated into the north (small) Aral sea in Kazakhstan and the south (large) Aral sea in Uzbekistan.
3) the south Aral sea further splits into western and Eastern lobes. In 2009, eastern lobe dried up but rebounded after more rain.
4) salinity increased in the field, crops in the region are destroyed, to flux out excess salts from field water is used many times.
5) desertification of the region, ecosystem collapse, river deltas feeding into it have been destroyed, dust storms are frequent leads to winters colder and summer hotter.
6) receding of coastlines, left large plains covered with salts, toxic chemicals from weapon testing, industrial and agriculture waste.
7) land around the Aral sea is heavily polluted, causing health problems to local people , there longevity falls, mortality increases,
8)fishing industry collapse, coast become the ship graveyards.

Solution and measures :-
1) alternative farming system such as less water intensive cotton varieties, avoid chemicals, shift to other crops, micro-irrigation
2) promoting non agricultural development in upstream countries.
3) plantation of area to increase rain and check duststorms
4) quality of irrigation canals need to be improved.
5) redirecting waters From other Rivera of Russia to restore Aral sea within 20-30 years. From river Volga, Ob, Irtysh and Caspian sea.
6) in 1994, all 5 central Asian countries signed a deal to recover the sea by allocating 1%of their budget for it's conservation .Aral sea basin programme was adopted in 1994 .
7) in 2006, world bank restoration project especially in the north Aral sea.

Tuesday, 19 February 2019

Mineral resources In India


Top Mineral Producer in India (State-wise) and other Countries

MINERAL
TYPE
MINES
TOP PRODUCERS (STATES)
TOP PRODUCERS (COUNTRIES)
TOP RESERVES (STATES)
IRON ORE
Metallic (Ferrous)
Barabil – Koira Valley(Orissa)
Bailadila Mine (Chattisgarh)
Dalli-Rajhara(CH) –
the largest mine in India
1. Orissa
2. Chattisgarh
3. Karnataka
 
1. China,
2. Australia,
3. Brazil
4. India
1. Orissa
2. Jharkhand
3. Chattisgarh
MANGANESE
Metallic (Ferrous)
Nagpur– Bhandara Region (Maharashtra)
Gondite Mines (Orissa)
Khondolite deposits (Orissa) 
1. Madhya Pradesh
2. Maharashtra
1. China
2. Gabon
3. South Africa
5. India
1. Orissa
2. Karnataka
3. Madhya Pradesh
CHROMITE
Metallic (Ferrous)
Sukinda Valley (Orissa)
Hasan Region (Karnataka)
1. Orissa
2. Karnataka
3. Andhra Pradesh
1.South Africa
2.India
3.Russia
1. Sukinda Valley (OR)
2. Guntur Region (AP)
NICKEL
Metallic (Ferrous)
Sukinda Valley (Orissa)
Singhbhum Region (Jharkhand)
1. Orissa
2. Jharkhand
1. Phillippines
2. Russia
3. Canada
1. Orissa
2. Jharkhand
3. Karnataka
COBALT
Metallic (Ferrous)
Singhbhum Region (Jharkhand)
Kendujhar (Orissa)
Tuensang (Nagaland)
1. Jharkhand
2. Orissa
3. Nagaland
1.Democratic Republic of Congo
2. China
3. Canada

BAUXITE
Metallic (Non-Ferrous)
Balangir(Orissa)
Koraput (Orissa)
Gumla(Jharkhand)
Shahdol (Madhya Pradesh)
1. Orissa
2. Gujarat
1. Australia
2. China,
3. Brazil
1. Junagarh (GJ)
2. Durg (CH)
COPPER
Metallic (Non-Ferrous)
Malanjkhand Belt (Madhya Pradesh)
Khetri Belt (Rajasthan)
Kho-Dariba (Rajasthan)
1. Madhya Pradesh
2. Rajasthan
3. Jharkhand
1. Chile
2. China
3. Peru
1. Rajasthan
2. Madhya Pradesh
3. Jharkhand
GOLD
Metallic (Non-Ferrous)
Kolar Gold Field (Karnataka)
Hutti Gold Field (Karnataka)
Ramagiri Mines (Andhra Pradesh)
Sunarnarekha Sands (Jharkhand)
1. Karnataka
2. Jharkhand
1. China
2. USA
3. South Africa
1. Bihar
2. Rajasthan
3. Karnataka
SILVER
Metallic (Non-Ferrous)
Zawar Mines (Rajasthan)
Tundoo Mines (Jharkhand)
Kolar Gold Fields (Karnataka)
1. Rajasthan
2. Karnataka
1. Peru
2. Mexico
3. China
1. Rajasthan
2. Jharkhand
LEAD
Metallic (Non-ferrous)
Rampura Aghucha (Rajasthan)
Sindesar Mines (Rajasthan)
1. Rajasthan
2. Andhra Pradesh
3. Madhya Pradesh
1. China
2. Australia
3. USA
1. Rajasthan
2. Madhya Pradesh
TIN
Metallic (Non-Ferrous)
Dantewada (Chhattisgarh)
Chhattisgarh (only state in India)
1. China
2. Indonesia
3. Peru
Chattisgarh
MAGNESIUM
Metallic (Non-Ferrous)
Chalk Hills (Tamilnadu)
Almora (Uttarakhand)
1. Tamil Nadu
2. Uttarakhand
3. Karnataka
1. China
2. Russia
3. Turkey
1. Tamil Nadu
2. Karnataka
LIMESTONE
Non-Metallic
Jabalpur (Madhya Pradesh)
Satna (Madhya Pradesh)
Cuddapah (AP)
1. Rajasthan
2. Madhya Pradesh
1. China
2. India
1. Andhra Pradesh
2. Rajasthan
3. Gujarat
MICA
Non-Metallic
Gudur Mines (Aandhra Pradesh)
Aravalis (RaJasthan)
Koderma (Jharkhand)
1. Andhra Pradesh
2. Rajasthan
3. Orissa
1. India
2. Russia

DOLOMITE
Non-Metallic
Bastar, Raigarh (Chhattisgarh)
Birmitrapur (Orissa)
Khammam Region (Aandhra Pradesh)
1. Chattisgarh
2. Andhra Pradesh
1. India
1. Chattisgarh
2. Orissa
ASBESTOS
Non-Metallic
Pali (Rajasthan) – largest mine
Cuddapah (Aandhra Pradesh)
1. Rajasthan
2. Andhra Pradesh
3. karnataka
1. Russia
2. China
1. Rajasthan
2. Andhra Pradesh
KYANITE
Non-Metallic
Pavri Mines (Maharashtra) – Oldest kyanite mine in india
Nawargaon Mines (Maharashtra)
1. Jharkhand
2. Maharashtra
3. Karnataka
1. USA
2. China
3. Japan
1. Maharastra
2. Jharkhand
GYPSUM
Non-Metallic
Jodhpur, Bikaner, Jaisalmer-Rajasthan
1. Rajasthan
2. Tamil Nadu
3. Gujarat
1. China
2. USA
3. Iran
1. Rajasthan
2. Tamil Nadu
3. J & K
DIAMOND
Non-Metallic
Majhgawan Panna Mines (Madhya Pradesh) – only active diamond mine in India
1. Madhya Pradesh – only diamond producing state
1. Russia
2. Bostwana
3. Democratic Republic of Congo

COAL
Non-Metallic (Energy)
Korba Coalfield, Birampur –Chhattisgarh
Jharia Coalfield, Bokaro Coalfield, Girdih –(Jharkhand)
Talcher field – (Orissa)
Singaruli coalfields (Chhattisgarh) - Largest
1. Chattisgarh
2. Jharkhand
3. Orissa
1. China
2. USA
3. India
1. Jharkhand
2. Orissa
3. Chattisgarh
PETROLEUM
Non-Metallic(Energy)
Lunej, Ankleshwar, Kalol–Gujarat
Mumbai high–Maharashtra – largest oil field
Digboi–Assam–Oldest oil filed in India
1. Maharastra
2. Gujarat
1. Russia
2. Saudi Arabia
3. USA
1. Gujarat
2. Maharastra
URANIUM
Atomic
Jaduguda mine (Jharkhand)
Tummalapalle mine (Andhra Pradesh) –largest mine
Domiasiat Mine (Meghalaya)
1. Andhra Pradesh
2. Jharkhand
3. Karnataka
1. Canada
2. Australia
3. Kazakhistan
1. Jharkhand
2. Andhra Pradesh
3. Karnataka
THORIUM
Atomic

1. Kerala
2. Jharkhand
3. Bihar
1. Australia
2. USA
3. India
1. Andhra Pradesh
2. Tamil Nadu
3. Kerala

Monday, 18 February 2019

Seismologists found Mountains and smooth plains within deep mantle below 660km boundary

Massive Bolivian earthquake reveals mountains 660km below our feet.::--
---------------------------------------------------

We know from school that earth interior consist of three layers the crust, the mantle and the core. All the topographic features lies over the crust. But recently seismologists discovered the mountains and  other topography within mantle.

Geophysicist used the seismic data from a massive earthquake in Bolivia to find mountains at the depth of 660km boundary. These underground mountains are larger than that on earth surface like Rockies, Andes, Appalachian, Himalayas, Alps,etc .

How and who discovered the topography like mountains within mantle?


The Princeton geophysicists Jessica Irving and Wenbo Wu, in collaboration with Sidao No from the Institute of Geodesy and Geophysics in China discovered the mountains and other topography on a layer located 660km depth, which separates the upper and lower mantle.

For this study they used data of the second largest deep earthquake ever recorded that shook Bolivia in 1994 of magnitude 8.2 earthquake. Seismologists and data scientists use Tiger supercomputers to simulate the behaviour of seismic waves in the deep earth.

Seismic waves (P-waves and S-wave) have ability to reflect(bounce) or refract (bend) when passes through medium. Straight path indicates homogeneous rocks but reflect or refract when they encounter any boundary or roughness. With the increase in one magnitude on Richter scale seismic energy increased by more than 32 times.

We know mantle constitutes 84% of the total volume of the earth. At the depth of 410 km to 660km within a mantle lies a transition zone  that separates upper and lower mantle. Below 660km boundary the heat energy cycle (mantle convection) produce two situation :-
1) well mixed upper and lower layers of mantle form homogeneous surface or plains.
2) not mixed, keep thermal and physical difference between the upper and lower mantle , represents the roughness within mantle. These roughness leads to mighty mountains below the 660km boundary.
 Geochemical and minerological differences arise due to subduction process of plates . Within the mantle subducted plates does not get melted and thus produce the reliefs like mountains and plains at the 660 km boundary or below.


Sunday, 17 February 2019

Greening of world study by NASA and others

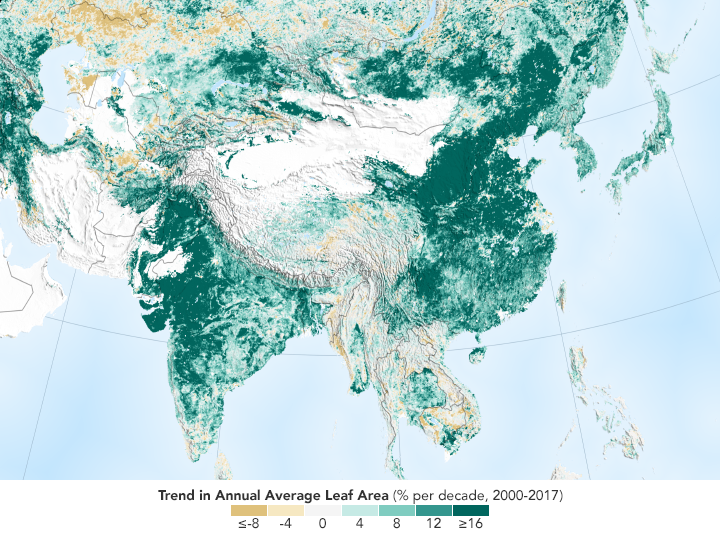
NASA two satellite, the Terra and the Aqua  has sensor known as Moderate resolution imaging spectroradiometer ( MODIS) data says that :--


-- One third Greening effort in the world in recent two decades is contributed by China and India due to the implementation of major tree planting projects alongside a vast increase in agriculture.
--- China and India account for one-third of the greening, but contain only 9% of the planet's land area covered in vegetation. 
--- China contribute 1/4th(25%) increase in green leaf area, despite possessing only 6.6% of world's Area. Forest account for that 42% of that increase, while croplands make up a further 32%.
---  India has contribute a further 6.8% rise in green leaf area,with 82% from cropland and 4.4% from forests.
--- due to multiple cropping practices, production of grains, vegetables, fruits and more have increased by 35-40% since 2000 to feed their large populations.
-- due to a warmer, wetter climate and fertilzation from added carbon dioxide in the atmosphere, leading to more green leaf cover.
--- due to environmental movement in India and China in 70's and 80's,  government and people realise to fix the problem caused by deforestation through social forestry programme , joint forest management, REDD plus initiative by UN, PAN programme increased the conserved and protected areas.
--- a direct line can not be drawn between an increase in global greening and a decrease in adverse impacts of climate change. For example in croplands the relationship of greening to carbon storage is even less clear.
--- but in same period there is a loss of leaf area in Tropical natural vegetation of Congo, Brazil and Indonesia.

Other impacts of carbon dioxide fertlization and  NPP on global greening.
--------------------------------------------------------------

--- Doubling atmospheric CO2 is likely going to cause some "greening" of the terrestrial biosphere globally under equilibrium conditions, especially if factors such as water and nutrient availability do not become limiting, Likely, much of the greening will manifest itself in the tropics, not in mid-latitudes; 
--- warming negates much of the CO2 effect Limiting growth factors are common throughout the terrestrial biosphere, thus the calculated "CO2-only" effects represent a best case scenario
--- Equilibrium conditions are a model construct not accounting for transient developments, particularly short-term weather extremes with the potential to eliminate long-term gains.

Sunday, 10 February 2019

India's Strategic Petroleum Reserves

India's Strategic Petroleum Reserves :--
------------+++++-------------++++++---------
 

Strategic petroleum reserves means storing crude oil in underground constructed rock caverns. These underground rock caverns are located on the east and west coast of India. Underground caverns are considered the safest means of storing hydrocarbons.

   To ensure energy security, the government of India also planned like USA, China and Japan to store crude oil for strategic reasons as given below :-
 1) to meet the emergency situations that leads to disruption of oil supplies.

 2) India's high dependence on import oil mainly from west Asia.
3)  Nearly 80% of our needs fulfilled by import. This can be disrupted due to political instability in west Asia, war and conflicts, or accidents or blockades, sanctions.
4) to reduce High oil inflation impacts , oil prices may be  crossing 100 rupees which has adverse impact on prices of other commodities.
5) strategic petroleum reserves (SPR) used to plug the demand -supply gap, providing raw material to oil refineries, to maintain GDP growth rate,
6) India is the 3rd largest energy consumer after US and China. There is a global practice to keep the strategic petroleum reserves of 90 days import. India has long way to go.

 What India has done to achieve this strategic petroleum reserves ?

In 2005, Government of India set up India strategic petroleum reserves (ISPR) limited , HQ at Noida. Strategic crude oil reserves, which are state funded to meet emergency situations, allows a country to meet the short time supply disruptions. International energy agency (IEA) members maintain emergency oil reserves equivalent to already 90 days of net imports.

At the time of growing uncertainties in global oil markets, such reserves will help India to manage supply and price rise . The number of days of reserves will not be static because as our demand keeps increasing. The number of days of our reserves also change. In today's demand scenario, refineries have an inbuilt capacity of 65 days.
 There is two phases to construct the strategic petroleum reserves in India.

Phase 1 involves addition of crude oil for 10 days with total storage of 5.33MMT reserves . This phase choosen 3 locations  east and west coast of India. It is completed.
To ensure energy security, the government of India has decided to set up 5.33Million metric tonnes (MMT) of strategic crude oil storage at 3 locations namely, Visakhapatnam(1.33 MMT), Manglore(1.5), and Padur -2.5 (near udupi,  karnataka) .only UAE based Abu dhabi National Oil Co (Adnoc) have committed to India's crude oil reserves programme till date.

 Phase 2  strategic reserves is also planned by government in 2 locations to add reserves for 12 more days with investments of $1.6billion. It consist of addition of 6.5mmt of total reserves where 4mmt at Chandikhol near Jajpur Odisha and 2.5MMT at Padur near udupi karnataka.
After completing this phase India's strategic reserves facilities together support 22 days of India's crude oil requirements. India's refineries also maintain 65 days of crude
oil storage, taking the total reserves for 87 days.

The created and proposed strategic petroleum reserves (SPR) of 11.83 million metric tonnes is supplied through pipelines and ships.

The PPP model promises valuable incentives to an array of stakeholders looking to make profit, logistics and location advantage; availability of low cost underground storage facility, suitable land parcel and geological settings for creation of SPR, promising opportunity for financing, to help sustainability of oil market,

Friday, 8 February 2019

Hindu kush Himalaya assessment report

Hindukush - Himalayan (HKH) assessment report published by Kathmandu based international centre for integrated mountain development (ICIMOD) :--
-------------------------------------------------------

The HKH is young folded greatest mountain system in the world covering 4.2 million sqkm across 8 countries : Afghanistan, Bangladesh, Bhutan, China, India, Myanmar , Nepal and Pakistan. The HKH is also refers to Third pole because of third largest icecover or Glacier outside north and south pole.


This region is vital due to following factors :

1) ecological significance , diverse flora and Fauna, vast reserves of natural resources such as 4 global biodiversity hotspots.
2) Third Pole significance, cryospherically,  largest reserves of ice outside the Polar regions. Mountainous Glacier.
3) Water resources role to Asian countries since HKH region is a source of 10 major Asian Rivers such as Gangs, Brahmaputra, Mekong, salween, Irrawaddy, Yangtze, Amur Darya, Tarim, Yellow, Indus.
4) sustainability of people : 240 million people depends directly on the HKH for lives and livelihoods. 1.9 billion people depends on on the HKH for water, food and  energy. > 35% of the world population benefits indirectly from HKH resources and ecosystem services. 3 billion people benefits from the food produced in it's river basins.
5) support diverse cultures, languages, religions and traditional knowledge systems of south east Asia, east Asia, South  Asia, central Asia.
6) High biodiversity, 330 important Bird and biodiversity areas.


Key issues in HKH are :--

--- vulnerable to erosion and landslides
--- region undergoing rapid change, driven by forces such as climate change, disasters, economic growth, globalisation, infrastructure development, land use change, migration and urbanisation.
--- even if global warming is limited to 1.5°C, warming will be likely be at least 0.3°C higher in the HKH, and at least 0.7°C higher in the North west Himalayas and karakoram. By the end of century (2100), the Hindu Kush Himalaya will warm by around 1.8°C.
--- There has been a rising trend of extreme warm events in the HKH over the past 5-6 decades, a falling trend of extreme cold events.
--- ghg's concentration increase, aerosols, increases and land use changes leads to extreme temperature , days and nights are getting warmer, extremes in precipitation increasing, the HKH will warm more than the global mean.  Even Tibetan plateau, central Himalayan range and karakoram will warm more than the HKH average, increasing western disturbances.
--- melting of HKH Glacier leads to thining, retreating, breaking , decreases it's areas,  will be affecting water supplies to Asian Rivers and lifelines of more than 35 %of world population get affected, water wars in Asian countries will be accelerating, food insecurity, starvation, hunger and poverty all will be aggravated.
--- biodiversity loss in the HKH region adversely affect the ecosystem and loss of ecosystem services to 1/4th of humanity. Since 1/4th of endemic species in the Indian Himalaya could be wiped out by 2100. The 70-80% of habitat lost in biodiversity in HKJ (relative to 1500A.D.) The 39% of HKH is under protected areas covering 1.6million sqkms. Biodiversity in HKH needs to be sustained to  ensure the continued flow of services.
--- The HKH remains energy poor despite it's huge hydropower potential of around 500GW because of low priority and failure to address challenges of remoteness and fragility, inadequate data is a barrier to context specific interventions.
--- the cryosphere of HKH affects the water supply due to decrease in snow covered areas and snow volumes, glaciers have thinned, retreated and ice-mass lost. Permafrost will continue to thaw and the depth of the active layer will increase. There is increased risk of dangerous glacial lake outburst floods (GLOF) since 1990's.
--- Hydrological trends related to cryospheric change are difficult to identify due to influence of discharge, scarcity in long term, high interannual variability.
--- water security or HKH is also described as water tower of Asia because it meltwaters and glaciers supply waters to Rivers, streamflow, groundwater. It provides water and ecosystem services for 2 billion people. Important for ensuring water, food, energy, and environmental security of the continent.
--- Increase in streamflow expected due to climate change till 2050 and decrease in pre-monsoon flow thereafter. Hydropower can disrupt natural flow regimes, inturn harming local irrigation, fisheries and ecosystems. India, Bangladesh, Pakistan and China together account for more than 50% of the worlds groundwater withdrawals.
--- food and nutritional insecurity remains a serious challenge in the HKH. More than 30% of the population suffer from food insecurity and around 50% face malnutrition. It is due to high poverty, natural resources depletion ,climate change, low market development, uncertain food support, inadequate policy and institutional support. The cultivation of traditional crops is declining, with a few crops dominance.
---  Air pollution in HKH is on the rise and air quality has worsened in the past two decades. Indo-Gangetic plains has persistent winter fog and haze. It is due to increase concentration of GHG's , accelerated melting in cryosphere through the deposition of black carbon and dust, and changing monsoon circulation and rainfall distribution over Asia. Aerosols is more absorbed in HKH due to higher concentration of SPM . It leads to melting of snow and glaciers, poor visibility as 90% during winters, affecting shifts in rainfall dynamics.
--- Natural hazards in the HKH are increasing  in magnitude and frequency due to climate change such as GLOF events due to the instability of moraine material.
--- mountain regions of the HKH have a higher incidence of economic, multidimensional and income poverty levels than the plains. Around 31%of HKH population is below poverty line, majority of people are poor and politically and socially marginalised.

L 26 JET STREAM CAUSES TYPES AND ROLE

JET STREAM & ITS SIGNIFICANCE MEANING AND ORIGIN  CHARACTERISTICS TYPES AND ITS DISTRIBUTION CAUSE AND MECHANISM WEATHER ASSOCIATED WITH...